Innovator theory and casm theory
In manufacturing, innovation (explosive popularization, or product thereof) is an important word and a goal.
In fact, in manufacturing, if we can innovate, is not it a successful person of manufacturing?
This time I will explain the theory which should be an indicator for innovation.
One is Innovator theory
The other is Cismuth theory .
The word theory seems to be difficult and I do not like it very much, but I would like to explain briefly.
Innovator theory
First of all, it is innovator theory. In the first place, what is innovator theory?
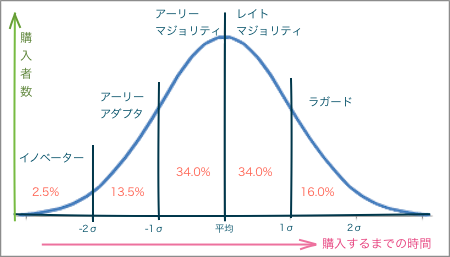
It is classified according to the correspondence at the time of product purchase along the normal distribution.
What is a normal distribution? I will briefly explain it for people.
Normal distribution is the distribution from average / center (variation).
The distribution is used to explain probability theory and statistical theory that the degree of variation will converge to the form of a graph of normal distribution.If there is no disturbance it will be surprising as it actually converges to that graph shape. Well, I do not think it is all ,,,, (The X axis center of the graph is average)
Well, in this case how you use it, say the time from purchasing the product to the time you purchase it . I think that everyone purchased a product and represents the distribution of time to purchase. I will leave it to the scholars’ people to see if it distributes like this, and I will see how to divide this theory.
· (anyone who purchases) innovator
(2.5% of the total)
People who buy anything as soon as a new product comes out
· (initial purchaser) Early Adapter
(13.5% of the total)
A person who considers products and purchases products with their own values. People who are comparatively social values and can lead the purchase of products. It is also called a pinion leader.
· (follow-up purchaser) Early Majority
(34.0% of the total)
People who think relatively carefully about new things. But those who purchase it under the influence of Early Adapter.
• (Follow-up buyer) Late Majority
(34.0% of the total)
People who are not very interested in new things. People who buy with the sense that trying to use the same thing because the majority purchase.
· (Those who do not buy without tradition) raggard
(16% of the total)
Especially conservative people. It is a person who does not handle new things, purchase it after matured for a long time as a product for many years. It also includes people who have no intention of purchasing at all.

It can be divided like this. Why is it such a way of dividing here? Some people thought so, so I will briefly explain. A standard normal distribution is used for this theory. Then the way of variation is determined (the unit of standard deviation is σ), so it can be seen as an indicator as to how much it is dispersed and where it is. The standard deviation concept is as follows. (Perhaps I think that the percentage explained earlier is easy to understand.I have such a thing, please, please.
· Innovator: (- 2σ or less)
· Early Adapter: (-2 σ ~ -1 σ)
· Early Majority: (-1 σ ~ 0)
· Late majority: (0 to 1σ)
· Ragged: (1 σ or more)
Products will be known to the market in this order as new products come out. If the majority know the product and purchase it, it can be said that it is “popular”.
Especially if it can be accepted as “(initial purchaser) early adapter” (it can be known to the majority of initial purchasers), it is told that the majority is known and “to spread”.
If it is accepted to more than 16% in a group, it is easy to understand that Early Adapter prioritizes its own interests and values to purchase products, Early Majority is convenience It is because the intention to purchase products is different.
Therefore, it can be said that you need to change the management approach to early adapter and Early Majority people. First of all, we offer brand newness for the early adapter, high value sought by society. In the case of Early Majority, it is necessary to convey the appeal of popularization and the sense of security and stability of products.
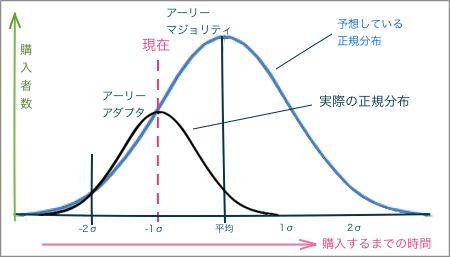
From here it is an arbitrary idea, but let us assume that the shape of prediction and actual normal distribution are the same. Suppose that the state of purchase of the product currently on sale is expected to be in the middle of the early adapter and Early majority (predicted -1 s position). However, if it is actually the position of the vertex of the normal distribution, the average value (the height of the center) of the number of purchasers originally thought is very different. Naturally, the total number of purchasers will be quite different as well.
I think that it is a difficult technique to actually grasp the current state accurately. Does it lead to the theory of casm? I think.

“Innovator” of paradigm shift concept is this article .
& Nbsp;

